Six areas of focus built and managed across home services, e-commerce, and a 90-location national franchise. Every result below comes from live campaigns — no estimates, no projections.
Paid Ads — Google PPC
Search campaigns managed to grow volume and hold efficiency at the same time. Daily search-term review, ongoing negative keywords, steady ad testing, and landing pages that match the ad a visitor clicked.
From 5 to 122 Conversions per Quarter: A 3-Year Google Ads Turnaround
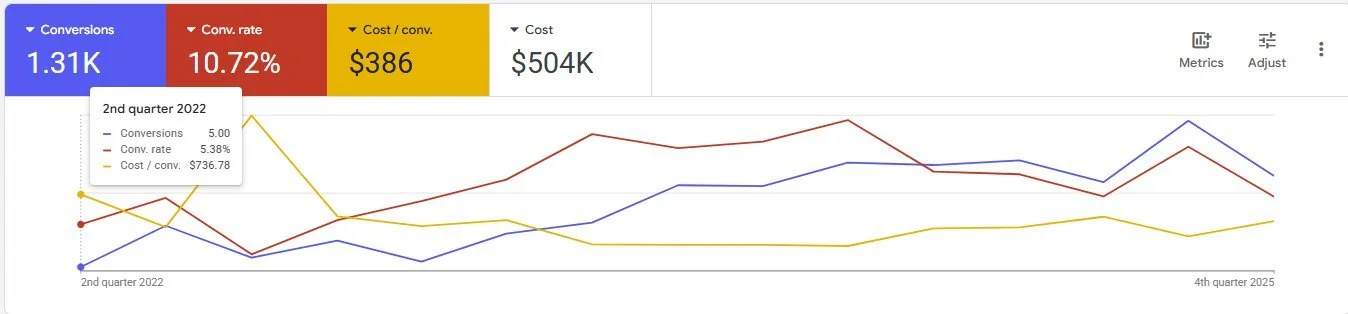
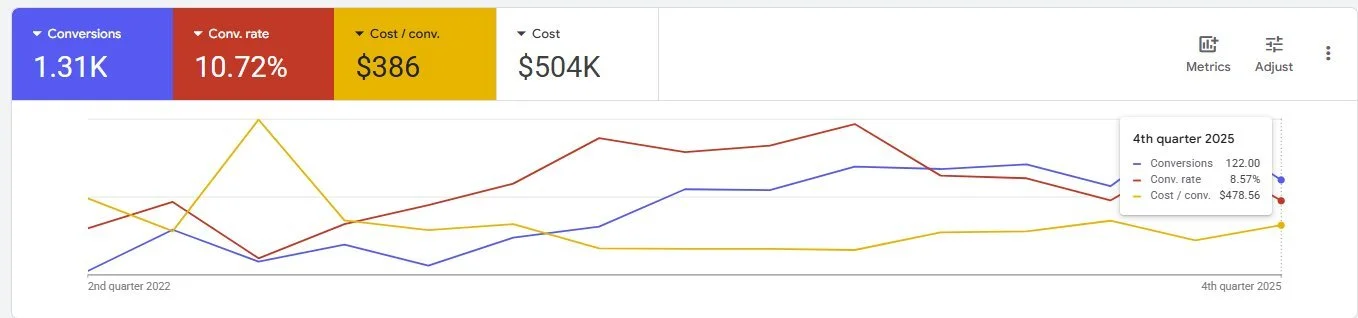
When I took over this Water Damage and Mold Remediation account in mid-2022, it was generating 5 conversions per quarter at $736 each. The 5.38% conversion rate pointed to waste on both the targeting and landing page side.
Daily search term reviews, continuous negative keyword work, and ongoing ad copy testing. Older strategies like pinning a discount, brand name, and trust signal as headlines were phased out as ad strength scoring started penalizing rigid pin structures. Landing pages were built mobile-first with H1s matching the ad headline, then structured to drive action.
Over 3 years, conversions grew from 5 to 122 per quarter. Conversion rate nearly doubled from 5.38% to 10.72%, and cost per conversion dropped 35% from $736 to $478. Total: 1,310 conversions on $504K spend.
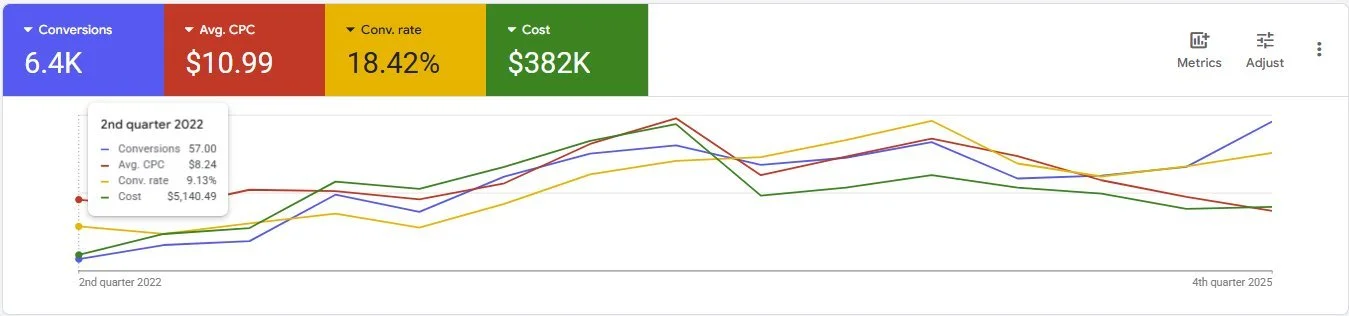
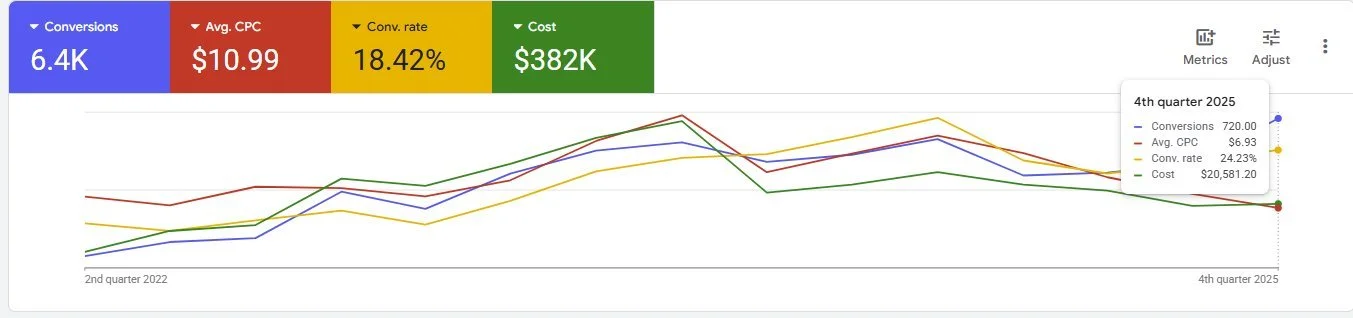
57 to 720 Conversions per Quarter While Dropping CPC
The Carpet and Tile campaigns had some early traction at 57 conversions per quarter and a 9.13% conversion rate, but performance was inconsistent. The goal was scaling volume without letting CPC creep up or conversion quality slip.
Same methodology as the water damage account. Daily search term reviews, ongoing negative keyword management, continuous ad copy testing, and mobile-optimized landing pages built to match the ad headline on arrival.
Conversions grew 12.6× from 57 to 720 per quarter by Q4 2025. Conversion rate more than doubled to 24.23%, and avg. CPC dropped from $8.24 to $6.93 despite spend quadrupling. Total: 6,400 conversions on $382K.
Remarketing & Lead Nurture
A follow-up system that keeps leads from going cold. Multi-stage pipelines with automated email and SMS that recover the inquiries most businesses lose.
54.68% Lead-to-Close Rate: Building a Full-Funnel Nurture System
The ads were generating leads, but there was no system for what happened after. In home services, a large portion of inbound leads can't be booked on the first contact. Without a follow-up process, those leads were just going cold.
Built a multi-stage lead pipeline in GoHighLevel connected to the Google Ads and website lead flow. Automated email and SMS sequences triggered at key stages, particularly at "unable to book," to keep leads warm and surface them for callbacks. The system tracked every lead's status so nothing sat unworked.
395 total opportunities, 3 lost. The "Unable to Book" stage converted at 76.46%, which is where most home service pipelines leak. Overall close rate landed at 54.68% with $22.15K in won revenue tracked through the CRM.


Email Marketing
Email programs built from nothing that move real revenue. Product-focused sends run as a two-step sequence, so every campaign gets a second chance to convert without extra work.
Building an Email Program from Zero: Flat Revenue to $70K Months
This e-commerce client had an existing customer base but no email program. Revenue was flat through 2024 with no way to drive repeat purchases or move seasonal inventory. We were starting from scratch.
We migrated from Mailchimp to GoHighLevel so opens and clicks could trigger follow-up actions rather than just being tracked passively. Campaigns were product-focused layouts with sections for new or overstocked items, each with its own buy button. Every send ran as a two-step sequence: full list on day one, then a follow-up to anyone who hadn't opened within 3 days.
Revenue jumped with the first email campaign in January 2025, then evened out month over month. Coupon redemptions hit 7,030, up 374% year over year. 15,310 opens and 1,710 clicks on a program that didn't exist before January 2025.


Revenue jumped with the first email campaign in January 2025, then evened out month over month as the list warmed and coupon redemptions became a reliable repeat-purchase driver. The chart makes that inflection point hard to miss.
CRM & Automation
The system that runs behind the marketing. Intake forms that launch campaigns, automated task routing, and recurring review cadences so accounts keep getting attention as the roster grows.
Building the Operating System Behind a 90-Location Franchise Ad Program
This cleaning franchise was opening new locations faster than the existing onboarding process could handle. Each new location needed Google Ads, LSAs, and Facebook campaigns built from scratch with no standard process. It worked at 20 locations. At 90 it would have broken down.
Built the onboarding process from scratch. New locations filled out an intake form that auto-created a ClickUp task with all fields pre-populated and triggered an automated email to schedule the onboarding call. Task completion triggered the ongoing maintenance cadence: weekly budget reviews, search term checks, auction insight reviews, policy checks, and a monthly performance report task.
The system scaled to 64 active locations running simultaneously, each with live status tracking across Google Ads, LSAs, and Meta. New locations went from form submission to campaigns in-flight within days. Weekly recurring tasks meant no account went unreviewed regardless of roster size.
Reporting & Analytics
Reporting that connects spend to booked jobs and revenue instead of clicks. Custom tracking fills the gaps platform APIs leave behind, delivered in dashboards anyone can read in a minute.
When the API Isn't Enough: Building a Custom LSA Reporting Stack
The LSA API doesn't surface lead-level detail. You can see how many leads came in and what they cost, but not which ones booked, completed, got credited, or what revenue was generated. Without that, clients had no way to measure actual ROI.
Built a custom Google Sheet to capture what the API couldn't: lead source, service category, scheduling status, charge status, job outcome, and revenue in one row per lead. A summary tab calculated booking rate, completion rate, and expected credits automatically. That data fed into two Looker Studio dashboards, one for LSA and one for Google Ads, delivered monthly with a plain-language notes section.
Clients got a monthly report connecting spend directly to booked jobs and revenue. The tracking sheet gave the internal team a view of lead quality rather than just volume, which informed both budget decisions and credit dispute filings.
Social Media & Meta Ads
Objective-based Facebook and Instagram campaigns across multiple markets. Each location's strategy matched to their goal without duplicating management overhead.
Multi-Location, Multi-Objective Facebook Ads Across a National Franchise
Each franchise location had different goals, budgets, and service priorities. A single campaign structure wouldn't work across markets with different competitive dynamics and launch stages. The challenge was running location-specific strategies without the management overhead multiplying alongside them.
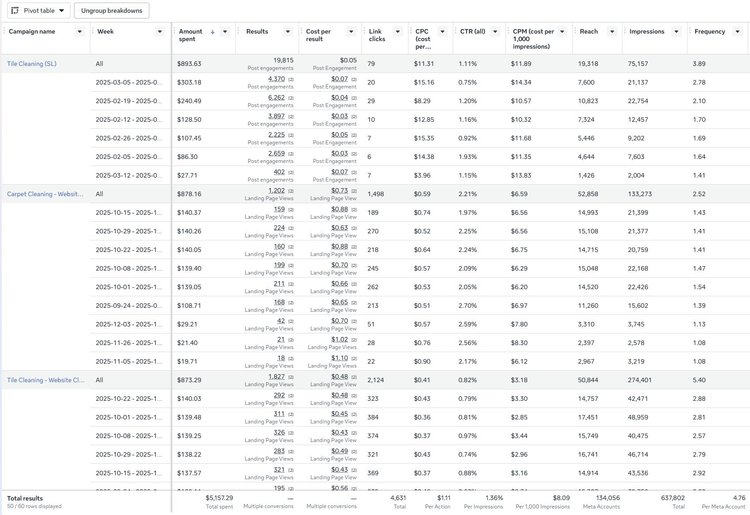
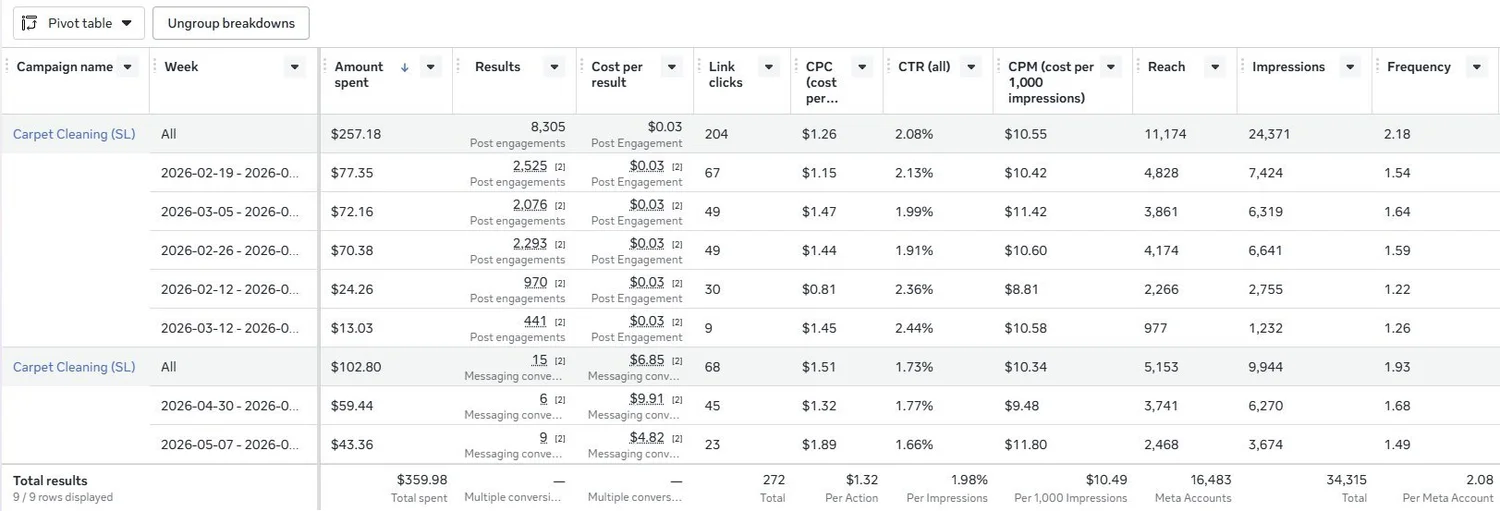
Each location ran one of three campaign types based on their current goal: messaging for direct conversations, traffic for landing page visits at low CPM, or engagement for brand presence in newer markets. Campaigns were built from service-line templates and customized with corporate-approved zip codes and location-specific exclusions.
637K+ impressions and 134K+ unique reach across active locations. CPMs ranged from $3.18 on traffic campaigns to $30 on messaging, with a blended average of $8.09. Messaging campaigns delivered conversations at $6.74 to $12.07 each. Engagement campaigns ran at $0.03 to $0.05 per interaction.